Close
Back
Driving change
together.
Responsibly.
Driving change
together. Responsibly.
Our purpose runs
through everything
we do


Driving change
together. Responsibly.
Our purpose runs
through everything
we do
Core to our business strategy, we deliver
our purpose via a clear focus on our three
strategic priorities, alongside our commitment
to doing business responsibly.
We are committed to being a responsible
business; driven by our resolve to do the right
thing, measure and report transparently and
always act ethically, and with integrity.
Our diverse and inclusive culture simply
wouldn’t be possible without our steadfast
commitment to our purpose. Pulling together,
we all work towards the same goal.
01
It actively guides
our strategy
02
It enables us to
make a difference
03
It drives our
values-led culture
We are the UK’s largest digital automotive
marketplace. We are embarking on a journey
where used and new car buyers can not only
complete their research on Auto Trader,
but complete more of the transaction too.
Growing our marketplace, delivering better
online buying and selling experiences, and
building stronger partnerships are all key to
this and form the focus of the people that
make it happen — I'm extremely proud of
our amazing teams that are shaping the future
of the automotive industry, day in, day out."

Retail Price Index
Published monthly, our RPI provides an overview of the latest retail price data
from across the whole UK market.
Our team of data scientists monitor
circa 800,000 vehicles each day, including 116,000 vehicle updates and an average of 39,000 vehicles added or removed from Auto Trader.


We are committed to being a responsible
business and our purpose is driven by our
resolve to do the right thing, measure and
report transparently and always act ethically
and with integrity.
As the UK's largest automotive marketplace,
we have a responsibility to create a more
accessible, equitable and more sustainable
future — for everybody.
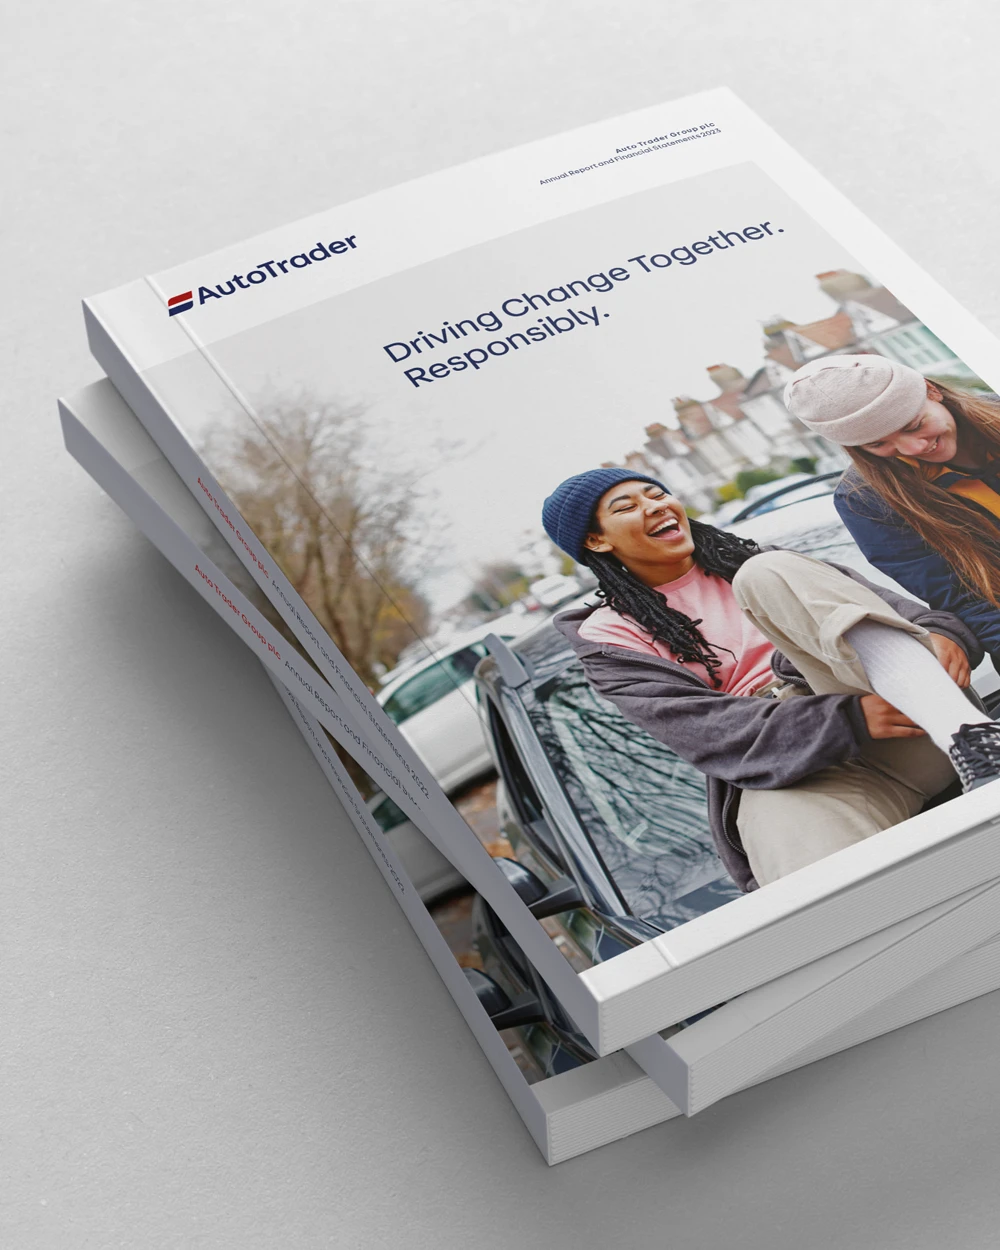
Annual report
Download
RNS & inside information
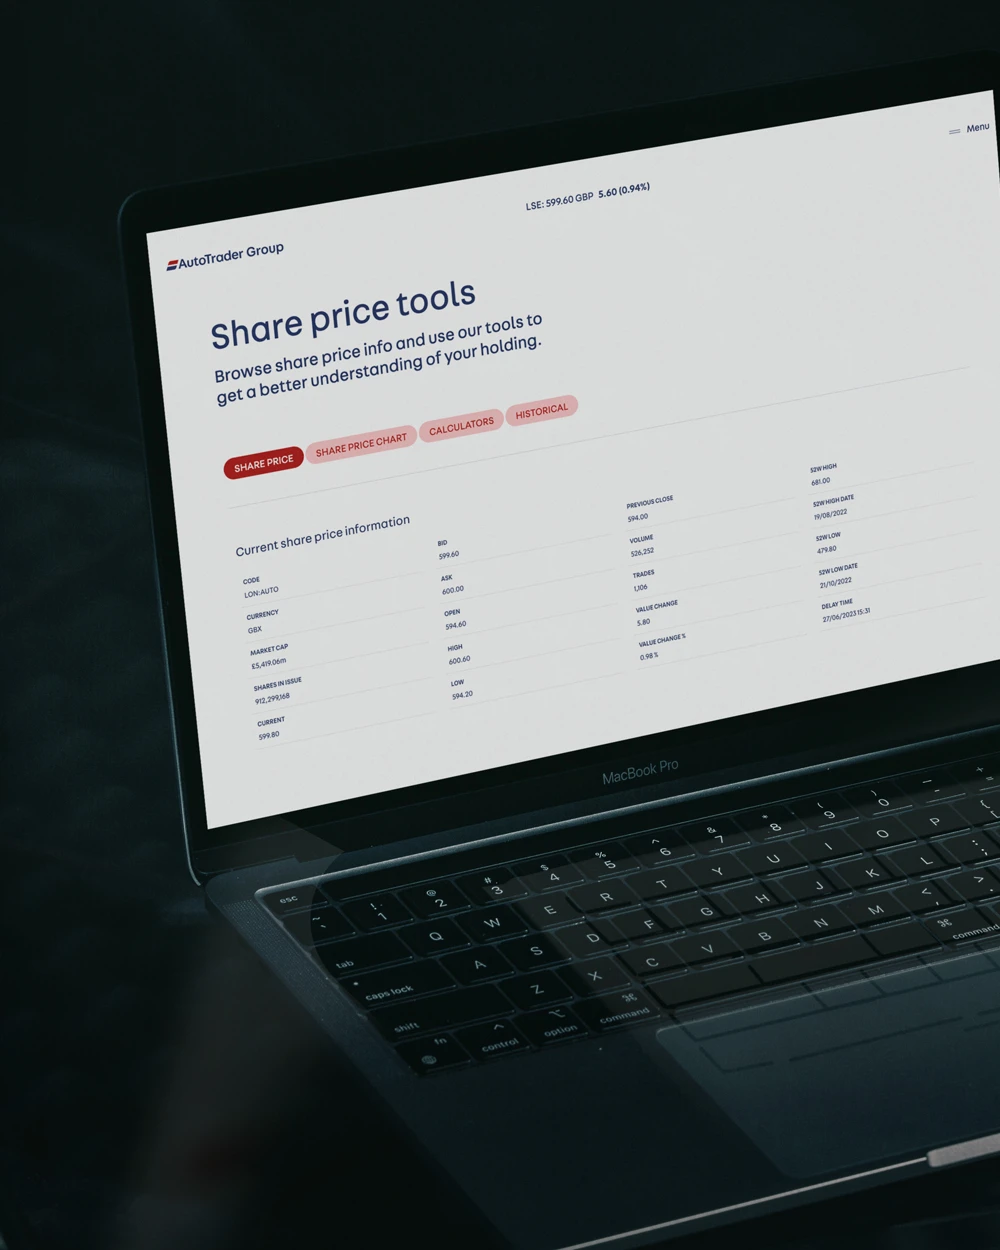
View allShare price tools
Find out more
01
Annual report
02
RNS & inside information
03
Share price tools
As leaders in our market, we are constantly innovating and looking to do things differently
Our trusted brand has been built over the last 45
years through advancements in our technology and
products, coupled with a highly skilled digital team.
By leveraging our leading market position and
technology platform we have a unique network effect
that allows us to create value for our stakeholders.
We are continually adapting our onsite experience
to meet the changing needs of both our consumers
and customers.
With an unrivalled data set and more
than four decades of experience, we
are the industry’s thought leader when
it comes to today’s — and tomorrow’s —
UK automotive marketplace

Sign up to our email alerts service:
Join our news & views mailing list
or submit media-related enquiries: